Track Your Project Progress Like a Pro With Burndown Charts

-
Insight
-
Project Management
In this blog, we will explore what a burndown chart is, how to set it up, and the difference between a burndown chart and a burnup chart.
TRACK YOUR PROJECT PROGRESS LIKE A PRO WITH BURNDOWN CHARTS
As a scrum master, keeping track of a project’s progress is part of your daily work. Burndown charts are a quick and effective way to achieve this goal. In this blog, we will explore what a burndown chart is, how to set it up, and the difference between a burndown chart (as we briefly discussed in our Calculate Your Way To Success blog) and a burnup chart.
WHAT IS A BURNDOWN CHART?
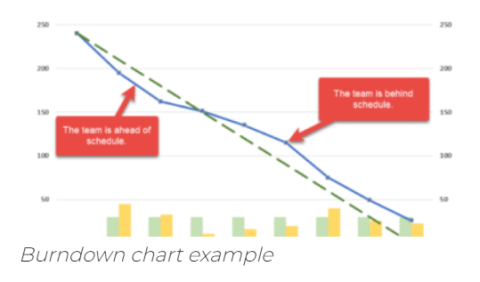
A burndown chart is a graphical representation of a project’s progress over time. It displays the story points versus the time left until the project’s deadline.
?PM Dictionary Tip
Story points = units of measure for expressing an estimate of the overall effort required to fully implement a product backlog item or any other piece of work
The ideal burndown chart would be a straight line sloping down to zero, indicating that all the work has been completed by the end of the project, taking into account the same velocity per sprint.
HOW TO SET UP A BURNDOWN CHART IN 5 STEPS
Step #1: Define the scope of the project. Before creating a burndown chart, it is essential to have a clear understanding of the project’s scope.
Step #2: Identify the stories or features. Once the project’s scope is defined, identify the stories, features, epics required to complete the project.
?PM Dictionary Tip
Epics = large bodies of work that can be broken down into a number of smaller tasks, called stories.
Step #3: Estimate the required effort by defining the story points per story, feature or epic. A story point is a relative measure unit and is the combination of the complexity, risks and the time-effort to complete it.
Good to know: the sum of all story points will help to determine the overall effort required to complete the project.
Step #4: Create the burndown chart by using
– a spreadsheet
– a dedicated Burndown chart tool
– or a white board
The chart should display the time axis on the x-axis and the remaining work on the y-axis.
Step #5: Update the chart regularly to reflect the progress made, as compared to the ideal straight line. This will help identify any potential delays/better progress or issues that could impact the project’s timeline.
WHAT IS THE DIFFERENCE BETWEEN A BURNDOWN CHART AND A BURNUP CHART?
While burndown charts show the effort remaining over time, burnup charts show the effort completed over time.
A burnup chart shows the project’s progress by displaying the total effort completed on the y-axis and the time axis on the x-axis.
In Agile methodologies such as Scrum, sprint burndown charts are used to follow up on sprint progress.
How? The difference with the normal burndown chart is that a sprint burndown chart uses story points on the y-axis and the sprint duration on the x-axis.
?PM Dictionary Tip
Sprint = a timed period during which a Scrum Team works to complete a specific volume of the workforce. Sprints are the most important part of Scrum, and effectively executing them can help agile teams create high-quality software more rapidly and often.
Sprint burndown charts provide valuable insights into the progress made during a sprint. They help the team identify potential issues that may arise during the sprint, such as delays or scope creep.
By tracking the progress of the sprint using a sprint burndown chart, the team can take immediate action to address any issues and ensure that they complete the stories within the specified sprint time frame.
CONCLUSION
In conclusion, burndown charts are a valuable tool for the scrum team to track the progress of a project. By setting up a burndown chart and updating it constantly, the scrum team and for sure the Product Owners can make informed decisions on different aspects, like
- re-prioritisation
- resource allocation
- velocity targets
Burndown charts provide a visual representation of the project’s progress, making it easy for team members and stakeholders to understand the status of the project.